Recently spoke at IEEE Power & Energy Society (PES) Transmission & Distribution (T&D) Expo on Microgrids for Smart Buildings, discussing how to add demand flexibility not only for customers’ buildings but also for utility grids. While preparing, an inconvenient truth emerged regarding our push for reducing the global greenhouse gas (GHG) footprint.
A 100% green power sector plus a 100% green transportation sector will NOT achieve the global or US GHG reduction needed to mitigate climate change targets set to date.
Let’s consider the US as an example. It is neither a leader nor a laggard in the GHG emissions reduction efforts globally. It is a good example of policy working on some of the issues, but not all.
The US EPA says that the US GHG footprint in 2020 was 5,981 million metric tons of CO2e. US EPA breaks this down to:
- Transportation: 1,628 million mT CO2e (27%)
- Power: 1,482 million mT CO2e (25%)
- Industry: 1,426 million mT CO2e (24%)
- Commercial & Residential [buildings]: 787 million mT CO2e (13%)
- Agriculture: 635 million mT CO2e (11%)
https://www.epa.gov/ghgemissions/inventory-us-greenhouse-gas-emissions-and-sinks
In the US, 2005 was a peak GHG emissions year at a total of 7,370 million metrics tons of CO2e.
- Transportation: 1,975 million mT CO2e (27%)
- Power: 2,457 million mT CO2e (33%)
- Industry: 1,536 million mT Co2e (21%)
- Commercial & Residential (C&R): 776 million mT Co2e (11%)
- Agriculture: 626 million mT Co2e (8%)
Spot check: A 19% reduction in GHG footprint in 15 years – only in Power and Transportation sectors.
President Biden has set a target of 50% reduction in economy-wide GHG footprint by 2030 from the 2005 GHG emissions. So, the target is 3,685 million mT CO2e or less in 2030. In addition, the US targets are net zero GHG power sector by 2035 and economy-wide net zero GHG emissions by 2050.
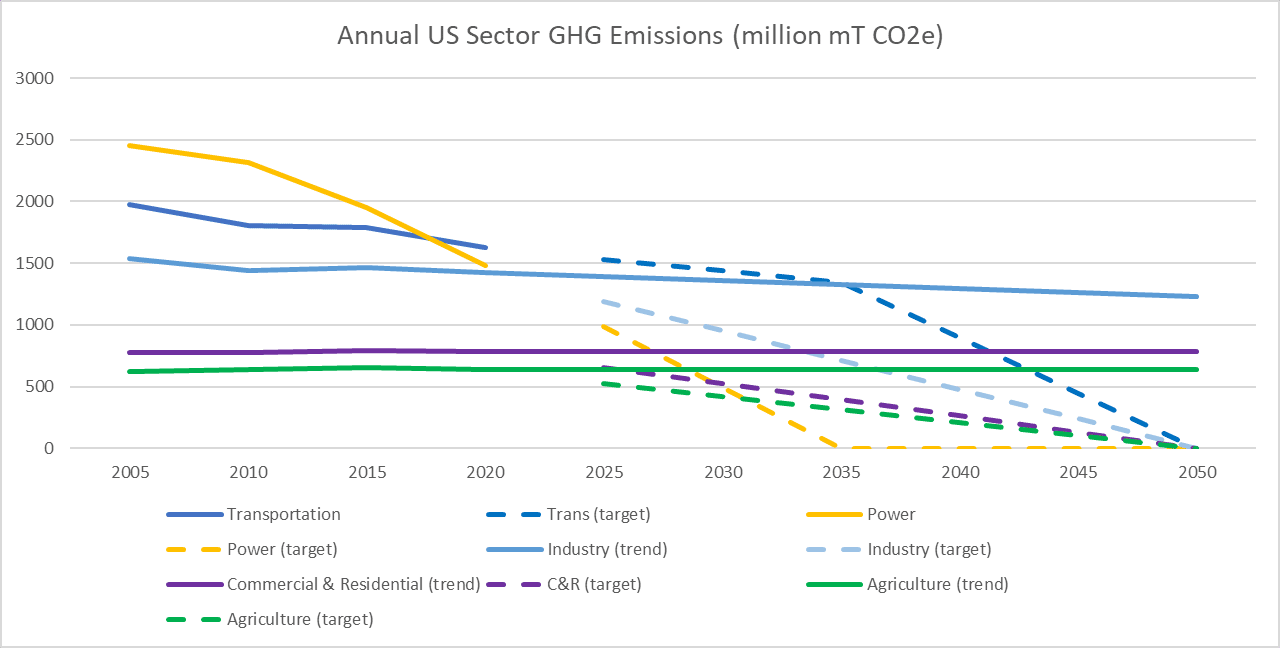
Power and transportation represent 52% of the GHG footprint, thus industry, agriculture, and buildings represent 48%. The Industry sector is on a token trend of 0.5% GHG reduction per year. Actually, the C&R buildings and Agriculture sectors are on a slightly upward trend in GHG emissions per year. This means there is no appreciable downward GHG trend or policy driver in industry, C&R, and agriculture.
So, with power and transportation both going to net-zero GHG, the US will still have 36% GHG footprint by 2050, NOT net-zero GHG as the President targets.
What does this difference between the current trend in GHG footprint sectors and the 2050 net-zero target mean? It means the Industry, Commercial & Residential (buildings), and Agriculture sectors have to move from 48% of the US GHG emissions now to zero by 2050 with no current federal or state policy drivers, and only modest corporate initiatives.
These are the “hard to decarbonize” sectors…with few drivers.
Contrary to the desired trend, the World Economic Forum this year shared the global trend in buildings which is growing from 220 billion m2 in 2020 to 440 billion m2 in 2060 due to urbanization (Accelerating the Decarbonization of Buildings, WEF, January 2022). This would represent a doubling of the C&R GHG footprint (787 million mT CO2e in 2020 to 1,574 million mT CO2e in 2060; or 1,377 million mT CO2e by 2050 (est. from the 2060 footprint)) – a 75% increase in C&R GHG – without substantial changes in new building codes and carbon-reduction schemes in the existing building stock.
Some of the most substantial GHG-reducing new building codes are targeting 20 – 25% source energy use reduction. This would mean the Commercial and Residential buildings GHG footprint would grow from 787 million mT CO2e in 2020 to 1,033 million mT CO2e by 2050 with a 25% source energy use reduction in new and existing buildings. This is a tough battle.
This would suggest that the US GHG footprint in 2050 would look something like this (2,897 million mT CO2e total), NOT net zero economy-wide:
- Transportation: zero mT CO2e (0%)
- Power: zero mT CO2e (0%)
- Industry: 1,229 million mT Co2e (42%)
- Commercial & Residential: 1,033 million mT Co2e (36%)
- Agriculture: 635 million mT Co2e (22%)
Conclusion – industrial processes, commercial and residential buildings, and agriculture NEED national, state, and corporate initiatives like the power and transportation sectors, or the US fails miserably to achieve net zero by 2050.
The “hard to decarb” sector will block the nation’s drive to net zero by 2050.